Our servers consume a lot of electricity. For this we of course use 100% green energy. We don't buy this electricity directly, but this energy is supplied by our data centres. We do validate their energy sources, as well as request Green certificates/GvOs from them. This should mean we do not emit CO₂, right?
Well, even though we are using 'green' energy, the energy coming out of the wall socket is always a mix of green and grey energy. It only becomes 100% green through certificates (GvOs). We wrote a lengthy article about this: sjoemel stroom. So even if on paper it’s green, that doesn't mean it is actually green.
We believe that even if our emissions from electricity are zero on paper, we should do our best to make them zero in real life as well. To that end, we calculate our yearly (combined) real CO₂ emissions, and based on those calculations, we compensate through Trees for All. We also invest an equal amount into the energy transition through Meewind. Under the current circumstances, we believe this is the best we can do.
Understanding how Green the Grid is
The grid is a mix of wind, solar, gas, coal, nuclear, and other energy sources. If there is more wind or sunshine on a given day, the usage of gas and/or coal goes down, making the grid greener. At night, energy usage is lower, but there is also no solar energy. So depending on wind speed, the grid can be clean or dirty. This fluctuates throughout the day.
Luckily nowadays, there is much more precise information available on how green the grid is. European grid managers are required to make this data available and the website Electricity Maps sifons this information in a great visualisation. This is expressed in the term gCO₂eq/kWh — in other words, the number of grams of CO₂ equivalent emitted per kilowatt-hour used.
This is valuable information, as we can use this to improve our calculations.
How can we use this (grid) data?
Recently we added this grid data to our calculations. This allows us to create a better understanding of the impact our operations have. To see this in action, we'll explain how much electricity is used and how we combine this with the grid data.
Energy usage (per rack)
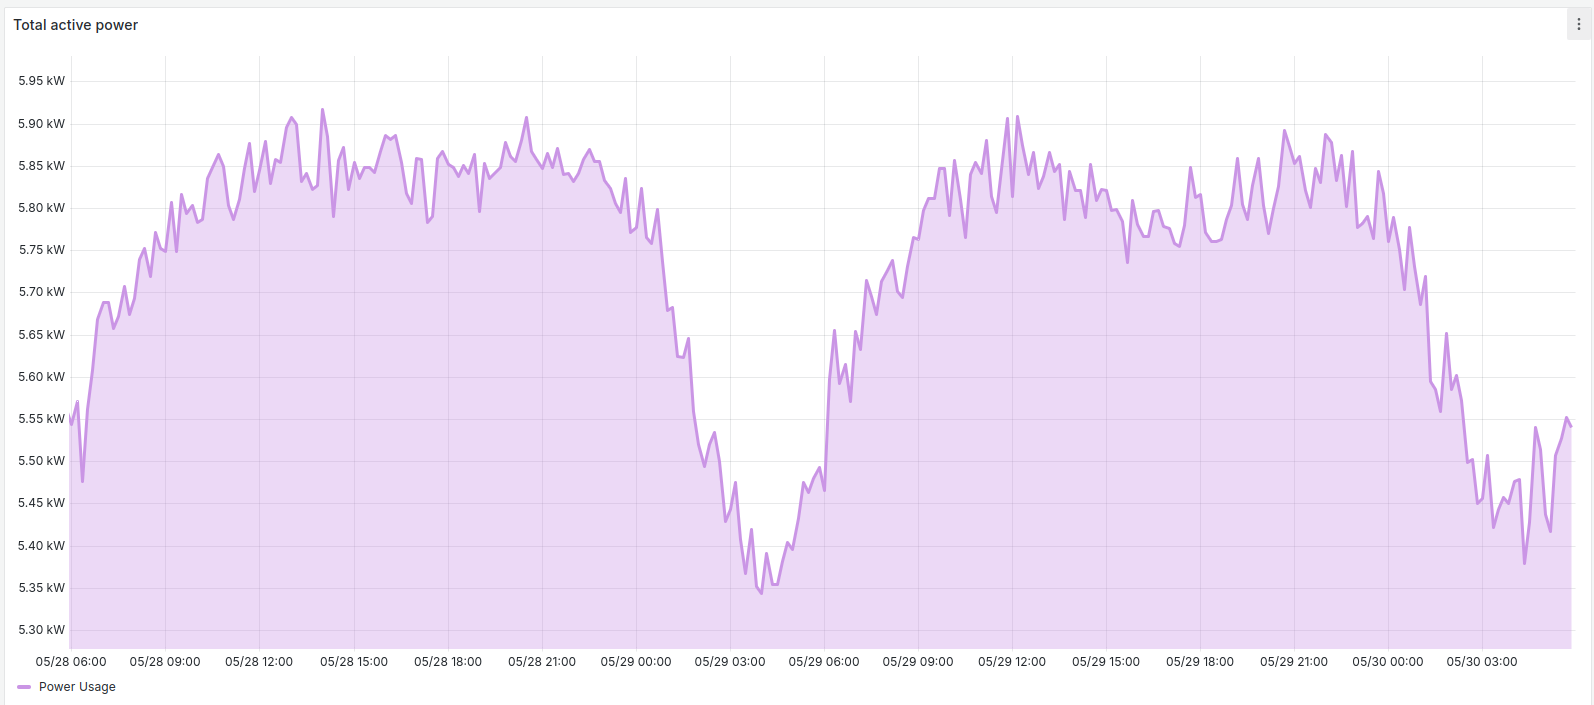
Servers are installed in a server rack. We operate multiple racks, usually each has a maximum capacity of ~5.5–6 kW. The below graph shows the energy consumption of a single rack, over a period of 48 hours.

As seen in the graph, during nighttime the platform is less busy and we consume less energy. However, the baseline for one rack is still about 5.35 kW, while the peak is at 5.90 kW (about 10% above baseline; note the Y-axis does not start at 0). So although there is variation, it is somewhat limited. We are experimenting with adjusting power settings of servers to improve energy savings. This can improve the saving a bit, but that effect will be limited as well.
The power grid
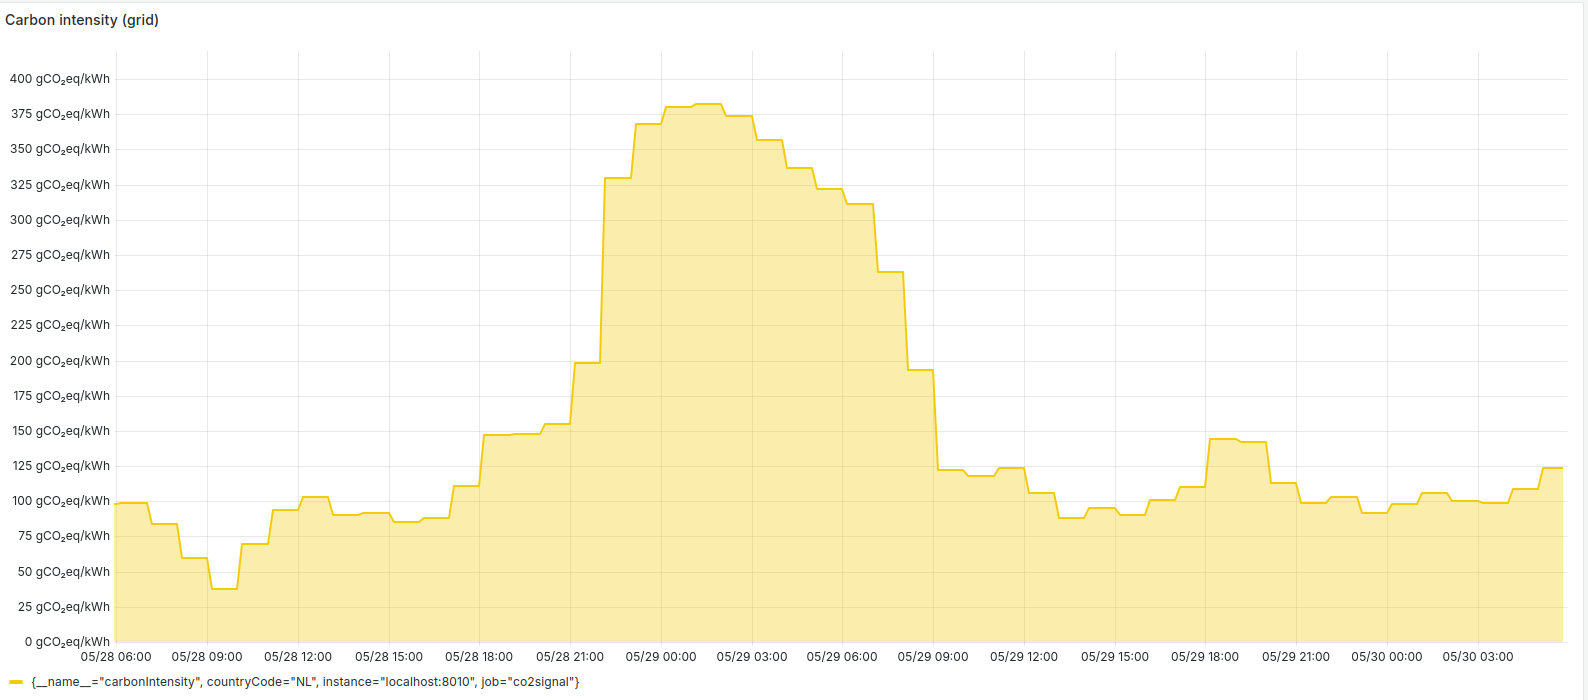
Now we add information about the grid. In this second graph, you see how efficient/green the grid is at specific times. For example, at nighttime on the 29th, the grid was not very clean with a value of 375 gCO₂eq/kWh, compared to daytime, when it was ~100 gCO₂eq/kWh. Of course, at night there is no production from solar panels. Apparently, during that night, wind speeds were also low, resulting in the need for more gas/unclean production of energy.

Combine both data.
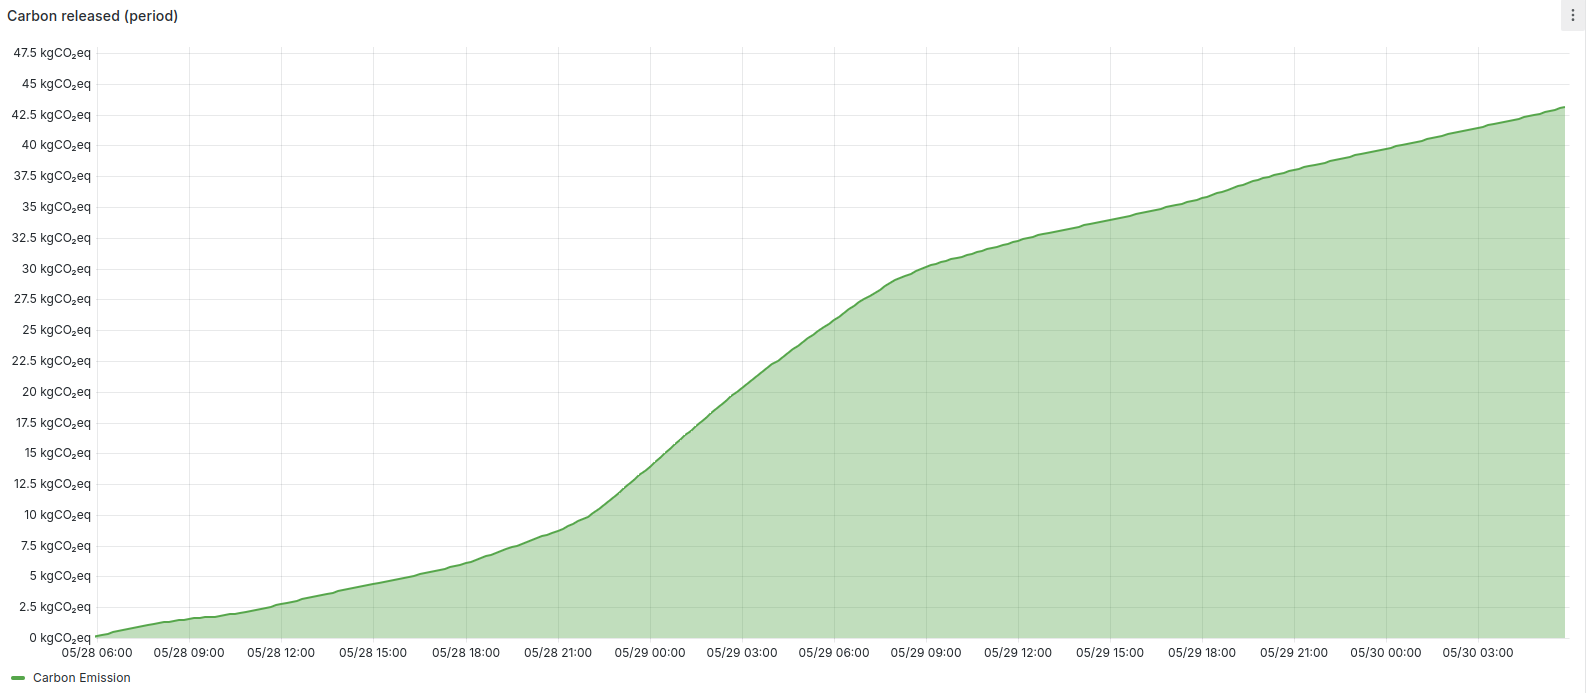
In the final graph, we calculate how much CO₂ was emitted over this 48 hour period. (Note, this graph shows the cumulative CO₂ emissions. This means the line can only go up.) Now we see that when our electricity usage becomes lower during the night (see the first graph), our emissions actually started increasing at a higher rate.

This makes sense, as we saw in the second graph, the grid power was less clean that night.
Conclusion
With this information combined, we have a much clearer picture of how much CO₂ we really emit. This helps us with our strategies to be more sustainable and decide where we should focus our efforts to make changes.
For the last years, we have used the average yearly data. Now we have the real-time data in hand, it is possible for us to revalidate our earlier estimations.
We are working on how to apply this information to improve our sustainability goals. For example by combining this data with the CO2-emissions during hardware manufacturing, this will have an effect on some policies. We will share more information about this in the near future.